



How a Google Ads Cost Calculator Works to Estimate PPC Budgets
A Google Ads cost calculator turns rough marketing projections into clear, mathematical formulas. Instead of guessing how much ad spend to commit each month, a calculator allows you to model your entire conversion funnel from the initial ad impression down to the final sale. It calculates how many visitors your budget can purchase, how many of those visitors will submit an inquiry, and how many inquiries will turn into paying clients.
Google Ads operates on an auction-based pay-per-click model. You do not pay when someone merely views your text ad in Google Search; you pay only when an interested searcher clicks through to your landing page. Official Google Ads budget planning tools manage your monthly expenditure by establishing an average daily spend cap. Because search traffic fluctuates by day of the week and local demand, Google may spend up to twice your daily budget on peak days, while guaranteeing your total monthly expenditure will not exceed 30.4 times your set daily budget across a full billing cycle.
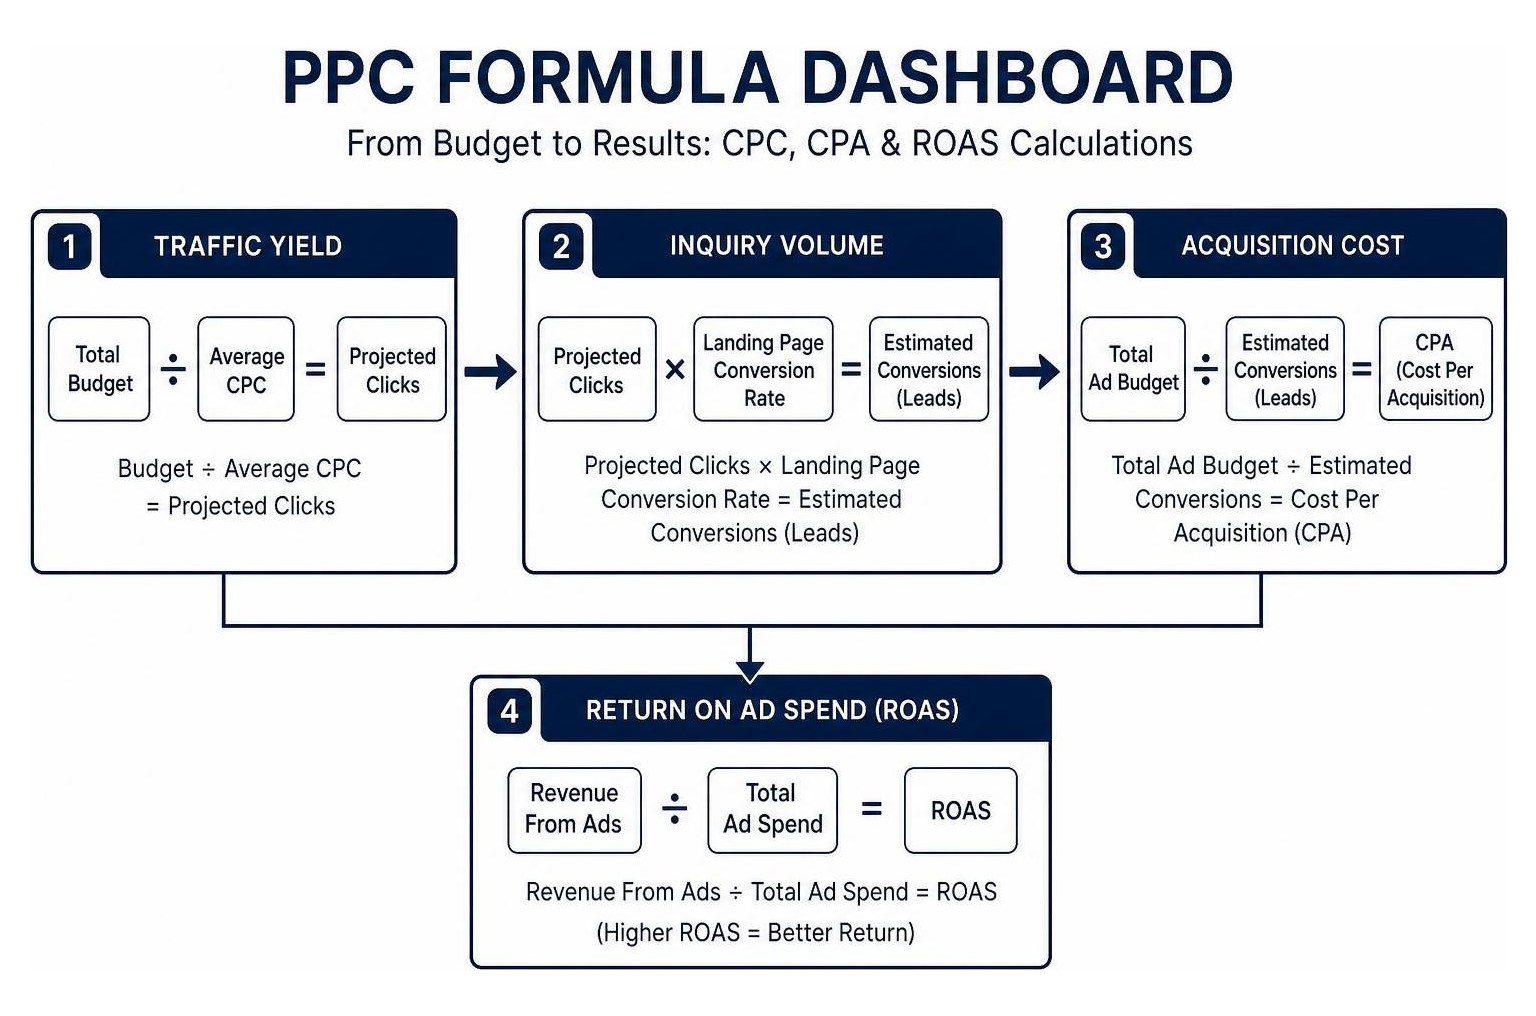
For local business owners across Chicagoland, reviewing a quick start guide to google ads for local businesses is often the first step in understanding these core parameters. When you plug your target numbers into a calculator, it computes three primary variables:
- Traffic Yield: Budget ÷ Average Cost Per Click (CPC) = Projected Clicks
- Inquiry Volume: Projected Clicks × Landing Page Conversion Rate = Estimated Conversions / Leads
- Acquisition Cost: Total Ad Budget ÷ Estimated Conversions = Cost Per Acquisition (CPA)
Essential Input Metrics: CPC, CPA, CTR, and Quality Score
To generate dependable forecasts, you need to understand the four primary metrics that fuel every cost calculation:
- Cost Per Click (CPC): The actual dollar amount billed when a user clicks your advertisement. Across all Google Search industries, the standard average ranges from $2.00 to $4.00, though competitive local niches in Cook County and Lake County can range substantially higher.
- Cost Per Acquisition (CPA): The total advertising cost required to generate a completed conversion action, such as a contact form submission, booked consultation, or phone call.
- Click-Through Rate (CTR): The percentage of users who click your ad after seeing it in the search results (Clicks ÷ Impressions × 100). Search campaigns average around 3% to 7% CTR.
- Quality Score: Google’s internal rating (graded from 1 to 10) evaluating keyword relevance, expected CTR, and landing page user experience. A high Quality Score of 8 to 10 earns auction discounts of 15% to 50% on your CPC, whereas poor Quality Scores (1 to 4) penalize your bids by increasing click costs up to 400%.
Understanding the Difference Between CPC and CPA
Many advertisers make the mistake of focusing strictly on securing the lowest possible Cost Per Click. However, cheap traffic rarely equals profitable customer acquisition.
Consider two contrasting campaign scenarios:
- Campaign A: Bids on broad, cheap keywords yielding a $0.50 CPC. Because traffic intent is low, only 0.5% of visitors convert on the website. To secure 1 lead, you need 200 clicks ($100 CPA).
- Campaign B: Bids on high-intent, local buyer terms at a $3.00 CPC. The targeted landing page converts at 6%. To secure 1 lead, you need roughly 17 clicks ($51 CPA).
Even though Campaign B pays six times more per individual click, its superior alignment with user intent cuts the final cost to acquire a lead nearly in half. A cost calculator demonstrates that CPA and down-funnel sales conversions are the metrics that dictate campaign health.
How to Reverse-Engineer Your Google Ads Budget From Revenue Goals
The most sustainable way to establish an advertising budget is goal-based budgeting. Rather than choosing an arbitrary figure like $500 or $1,000 per month and hoping for the best, you work backward from your net sales targets.
By defining your required customer volume and understanding the ultimate guide to search engine marketing leads and how to capture them, you can build an airtight ad plan that accounts for lead closing rates and click-to-lead ratios.
Step-by-Step: Using a Google Ads Cost Calculator for Revenue-Based Budgeting
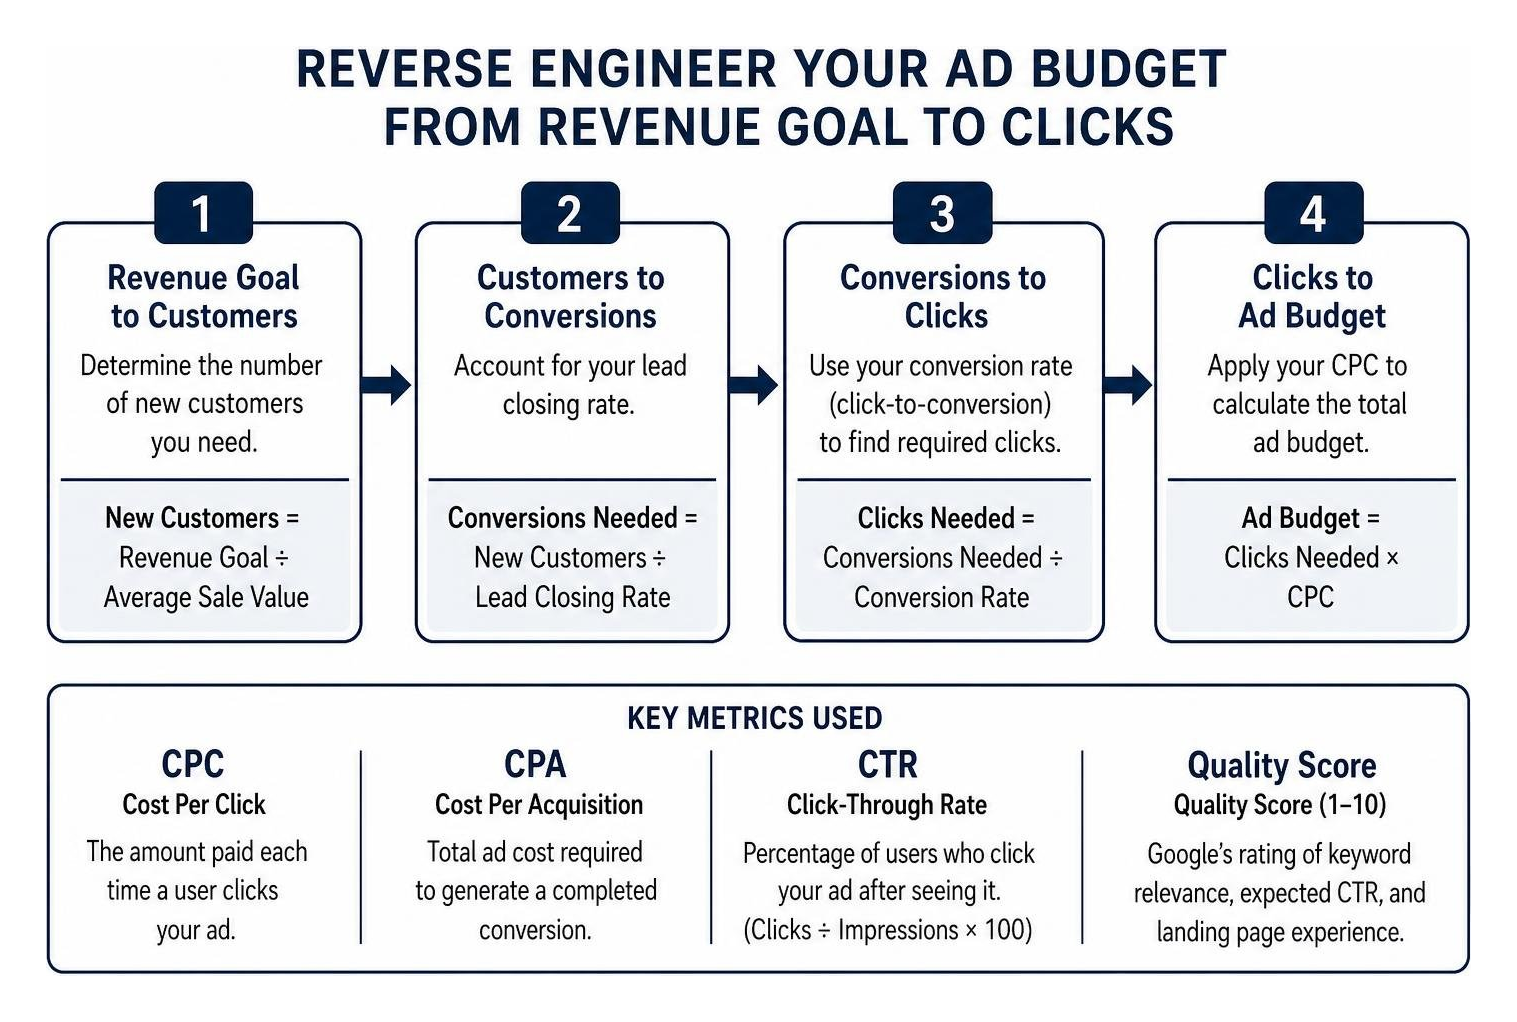
Follow this straightforward four-step calculation process:
- Calculate Required New Customers: Divide your monthly revenue goal by your average sale value (deal size). If your goal is $30,000 in new revenue and your average contract value is $1,500, you need 20 new customers ($30,000 ÷ $1,500 = 20).
- Calculate Required Leads: Divide the required customer count by your sales closing rate. If your team converts 20% of inbound phone calls and forms into closed clients, you need 100 raw leads (20 ÷ 0.20 = 100).
- Calculate Required Website Visits: Divide your required leads by your website’s landing page conversion rate. Assuming an industry-standard 5% conversion rate, you need 2,000 clicks (100 ÷ 0.05 = 2,000).
- Determine Required Monthly Ad Budget: Multiply required clicks by your estimated industry CPC. If the benchmark CPC in your market is $2.50, your required monthly ad spend is $5,000 (2,000 × $2.50 = $5,000). To establish your daily Google Ads budget, divide by 30.4 ($5,000 ÷ 30.4 = $164.47/day).
| Industry / Vertical | Average Search CPC | Average Conversion Rate | Recommended Starting Budget |
|---|---|---|---|
| E-commerce & Retail | $1.16 – $2.50 | 3.75% | $1,500 – $3,500/mo |
| Home Services (HVAC, Plumbing) | $9.50 – $12.00 | 5.00% | $2,000 – $5,000/mo |
| Healthcare & Dental | $2.62 – $12.00 | 7.19% | $2,000 – $4,500/mo |
| B2B & Professional Services | $3.33 – $10.00 | 1.55% – 3.00% | $2,500 – $6,000/mo |
| Real Estate & Mortgages | $2.50 – $20.00 | 2.50% – 4.00% | $2,000 – $5,000/mo |
| Legal (Personal Injury, Defense) | $8.58 – $50.00+ | 5.30% | $5,000 – $15,000+/mo |
Determining Break-Even ROAS and ROMI
Return on Ad Spend (ROAS) calculates gross revenue generated per ad dollar spent:
$$\text{ROAS} = \frac{\text{Gross Revenue from Ads}}{\text{Total Ad Spend}}$$
A ROAS of 4:1 (or 400%) means every $1 invested in Google Ads produced $4 in gross sales. However, ROAS alone does not indicate whether your business made money. You must account for Cost of Goods Sold (COGS), labor, payment gateway processing fees (typically 2.9% + $0.30), and overhead.
To determine your Break-Even ROAS, use this formula:
$$\text{Break-Even ROAS} = \frac{\text{Total Operational Costs} + \text{Ad Spend}}{\text{Ad Spend}}$$
For true profitability, we track Return on Marketing Investment (ROMI):
$$\text{ROMI} = \left(\frac{\text{Gross Revenue} – \text{COGS} – \text{Marketing Spend}}{\text{Marketing Spend}}\right) \times 100$$
If your ROMI calculation produces a figure above 100%, your campaigns are generating net profit above all marketing and operational fulfillment costs.
Industry Benchmarks and Multi-Campaign Budget Allocation
Different advertising campaign types fulfill unique objectives within your sales funnel. Allocating your budget effectively requires matching your commercial goals with the right Google network.
Local service providers benefit heavily from specialized campaign structures. For trade specialists, reviewing plumbing google ads the ultimate guide to unclogging your lead pipeline or the ultimate guide to comparing ppc management for electricians shows how intent-driven search terms capture customers during immediate service emergencies.
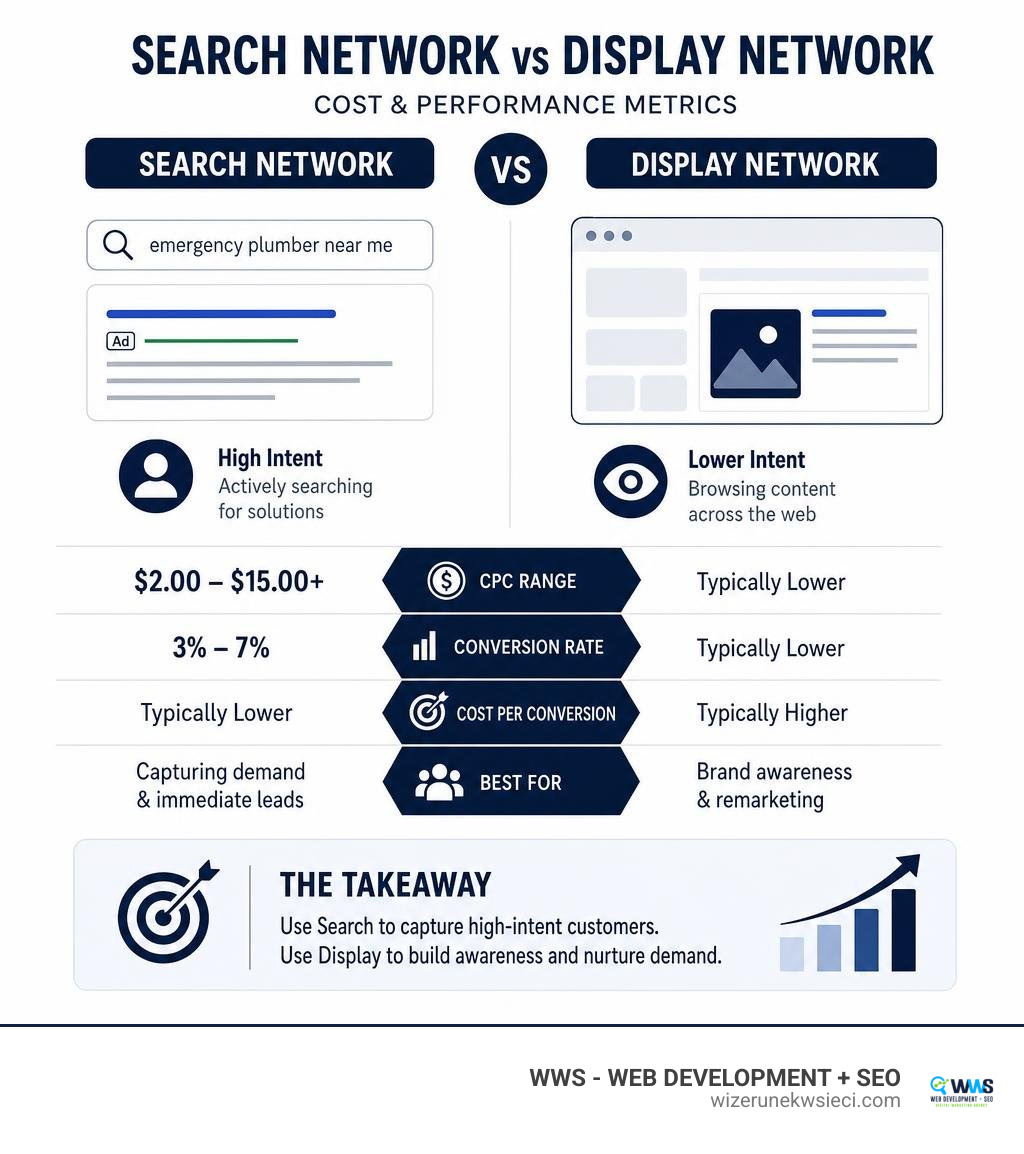
Search vs. Display Network Cost Structures
Google Search and Google Display serve completely different functions:
- Google Search Network: Targets active intent. Users type exact keywords seeking solutions (e.g., “commercial roofing contractor Arlington Heights IL”). CPCs are higher ($2.00 to $15.00+), but conversion rates are strong (3% to 7%) because users possess immediate purchasing intent.
- Google Display Network: Targets passive interest. Visual banners appear across millions of partner websites and apps. CPCs are very low ($0.50 to $1.50) and CPMs (cost per thousand impressions) range from $0.50 to $3.00. However, average CTR is lower (0.5% to 1.0%), making Display ideal for remarketing to past website visitors rather than capturing cold, direct leads.
Campaign Type Budget Distribution
When structuring a comprehensive Google Ads account, we recommend using the 60/30/10 Budget Rule:
- 60% Core High-Intent Search: Allocated to exact and phrase-match keywords targeting bottom-funnel commercial searches.
- 30% Secondary & Remarketing: Dedicated to broader category terms, Performance Max assets, or Display/YouTube retargeting to re-engage past visitors.
- 10% Experimental Testing: Reserved for testing new keyword concepts, ad copy variations, and emerging audience segments.
To enable Google’s automated Smart Bidding algorithms (such as Target CPA and Target ROAS) to function effectively, an account needs at least 30 to 50 conversion actions per month. Underfunding campaigns below this data threshold prevents machine learning models from optimizing bids accurately.
Strategies to Lower PPC Costs and Maximize Profitability
Controlling advertising expenses is not about slashing your daily budget; it is about eliminating wasted clicks so every dollar works toward customer acquisition. In real estate, for example, reviewing google ads for realtors a guide to high intent lead generation illustrates how filtering out unqualified clicks preserves capital for high-value client acquisitions.
Common Pitfalls When Using a Google Ads Cost Calculator
- Ignoring Backend Fulfillment Costs: Calculating ad profitability on gross revenue without deducting product costs, shipping, and merchant processing fees.
- Underfunding the Learning Phase: Starting with a budget that yields fewer than 100 clicks per month, starving Google’s bidding systems of the data required to optimize.
- Expecting Instant Maximum ROI: Google Ads campaigns typically require 60 to 90 days of negative keyword sculpting and search term refinement to reach peak profitability.
- Assuming Static CPCs Year-Round: Failing to anticipate seasonal auction spikes in Q4 or vertical-specific surges (such as summer demand for HVAC contractors across the Northwest Suburbs of Chicago).
Proven Tactics to Reduce CPC and Lower CPA
- Build Robust Negative Keyword Lists: Add negative match terms (such as “free,” “jobs,” “cheap,” “salary,” “DIY”) to prevent your ads from triggering on non-commercial search queries.
- Tighten Match Types: Shift away from uncontrolled broad match terms toward phrase match and exact match variations that preserve budget for high-intent queries.
- Improve Landing Page Speed and Mobile UX: Enhancing mobile loading speeds and streamlining contact forms directly improves conversion rates while elevating Quality Scores, lowering your effective CPC.
- Apply Strategic Location Adjustments: Monitor regional performance across specific service territories—such as Schaumburg, Naperville, Northbrook, or Glenview—and apply positive or negative bid modifiers based on where your highest-margin jobs originate.
Frequently Asked Questions About Google Ads Costs
How accurate is a Google Ads budget calculation?
A cost calculator provides a reliable mathematical baseline using historical benchmark averages. However, actual live results vary based on local auction competition, real-time bid adjustments, ad copy relevance, seasonal demand surges, and landing page conversion efficiency.
What is a good ROAS and CPC for Google Ads?
For most small and mid-sized businesses, a target ROAS between 3:1 (300%) and 5:1 (500%) delivers healthy net profitability after accounting for operational overhead and COGS. A competitive CPC generally falls between $2.00 and $4.00 on the Search Network, though localized high-value service niches routinely see higher rates that remain profitable due to high customer lifetime values.
What is the minimum monthly budget required to see results?
While Google Ads has no formal minimum spend requirement, investing at least $1,000 to $2,000 per month is strongly recommended for standard Search campaigns. This budget level ensures your campaigns generate sufficient click volume (150 to 300+ visits) to exit the learning phase, trigger conversion tracking milestones, and produce predictable customer inquiries.
Maximize Your Advertising ROI With Professional PPC Management
Accurate budget forecasting transforms Google Ads from an unpredictable expense into a scalable growth engine for your business. When you understand your exact numbers—from CPC to Break-Even ROAS—you can invest marketing dollars with complete confidence.
At Wizerunek w Sieci / WWS — Web Development + SEO, we combine high-level technical expertise with personalized, dedicated service. Headquartered in Des Plaines, IL, our team provides bilingual (English and Polish) PPC campaign management, search engine optimization, and custom web development for small and medium-sized businesses throughout the Chicago metropolitan area, Cook County, Lake County, and across the United States.
Whether you operate a local home service company in Park Ridge or an expanding enterprise in Naperville, we treat your advertising budget with the same care and scrutiny as our own. We continuously refine your campaign structures, expand negative keyword lists, and optimize conversion pathways to ensure every ad dollar drives verified business inquiries.
Take control of your growth strategy today. Explore our managed paid campaigns or visit wizerunekwsieci.com (636 S River Rd #218, Des Plaines, IL 60016) to claim your free website audit and comprehensive PPC performance review.