


Core Web Vitals for Local Business Sites: A Practical Guide
Learn how to check, read and fix Core Web Vitals on a local business website, from Chrome DevTools to Search Console, with thresholds and a repeatable audit.
 By WWS Team
11 min read

In this article13 sections
- TL;DR
- What the three metrics mean for a service business
- Local metrics versus field data: why they disagree
- A repeatable six-step check for a local landing page
- Fixes that move the numbers on local service sites
- Do Core Web Vitals help local rankings?
- Our perspective: fix what costs you calls
- When to bring in help
- Keeping watch after the fix
- Core Web Vitals checklist for a local site
- FAQ
- Sources
- Recommended
For a local business website, Core Web Vitals come down to three numbers: how fast the main content loads (LCP), how quickly the page reacts when someone taps (INP) and how stable the layout stays (CLS). You can see them live on your own device in Chrome DevTools. But the number that matters to Google comes from real visitors, and you read it in PageSpeed Insights and Search Console. This guide shows you how to check both, how to tell them apart and what to fix first on a service page.
We are WWS, a web development and SEO team in Des Plaines, IL. We build and tune websites for Chicago-area contractors, restaurants, dental practices and other service businesses. The advice below is the process we would hand to any owner who asks why a phone-friendly site still feels slow.
TL;DR
- A page passes when, at the 75th percentile of visits, LCP is 2.5 seconds or less, INP is under 200 milliseconds and CLS is under 0.1.
- “Local” metrics from DevTools are for diagnosis on your device. Pass or fail for Search is judged on field data from real users.
- Use PageSpeed Insights for a quick check, Search Console for page groups over time and DevTools to find the cause.
- Good scores support rankings but do not guarantee them. Relevance, accurate business information and service-area content still lead.
What the three metrics mean for a service business
Google describes Core Web Vitals as metrics for real-world user experience: loading, interactivity and visual stability. Here is what each looks like on a typical local site.
| Metric | What it measures | Good result | Typical local-site culprit |
|---|---|---|---|
| LCP (Largest Contentful Paint) | How long the biggest visible element takes to appear | 2.5 s or less | Oversized hero photo of a finished roof or kitchen, slow server |
| INP (Interaction to Next Paint) | How fast the page responds to taps and clicks | Under 200 ms | Heavy chat widgets, booking scripts, sticky call bars |
| CLS (Cumulative Layout Shift) | How much content jumps while loading | Under 0.1 | Images without dimensions, late-loading banners and review widgets |
The thresholds come from Google Search Central, which also says results are evaluated at the 75th percentile of page loads and segmented by mobile and desktop. In plain terms: three out of four visits must be at least that good, separately for phones and computers.
For a homeowner with a flooded basement searching on a phone, those numbers are not abstract. A hero image that takes four seconds, or a call button that moves as they tap it, costs you the call.
Local metrics versus field data: why they disagree
The keyword “core web vitals local” usually points at one of two things. Some people mean the live metrics inside Chrome DevTools. Others mean how Core Web Vitals apply to a local business. Both matter, and mixing them up is the most common mistake we see.
Local (lab) data is measured on your machine, right now. The Chrome team’s live metrics view in the Performance panel shows LCP and CLS as the page loads, and INP once you interact with it. It is instant and excellent for debugging.
Field data is collected from real Chrome users over time. PageSpeed Insights reports the past 28 days, and Search Console shows history for properties you have verified.
According to web.dev’s guidance on lab and field differences, field data tells you what real visitors experience, while lab data is generally better at revealing the likely cause. When the two disagree, treat it as information.
Three reasons they diverge for Chicago-area sites:
- Your computer is faster than your customers’ phones. A fast office machine and a warm browser cache can hide problems that real visitors hit.
- Networks vary. A customer on a weak connection in a basement or a job site does not load your page like your office Wi-Fi does.
- Real users interact in ways a test does not. INP depends on what people actually tap, so a single local run can miss slow interactions.
The Chrome team makes the same point: comparing local results with real-user data keeps you from optimizing issues most visitors never see, or from overlooking problems hidden by a fast development machine.
A repeatable six-step check for a local landing page
Use this order. It starts with what Google sees and ends with what you can change.
Step 1: Pick the pages that earn calls
Do not audit the whole site. Start with the pages that bring in leads: the home page, each main service page (roof replacement, water damage restoration, HVAC repair, dental implants, kitchen remodeling) and your city or service-area pages. Core Web Vitals problems usually repeat across a template, so fixing one page often fixes a group.
Step 2: Check field data in PageSpeed Insights
Enter the URL in PageSpeed Insights. If the page has enough traffic, you see real-user results for LCP, INP and CLS, usually for the page and the whole origin. This is your pass or fail view. Check mobile first, then desktop.
Small local sites sometimes lack enough data for page-level results. In that case the origin-level result, or the lab result with that caveat in mind, is what you have.
Step 3: Find page groups in Search Console
Search Console requires verified ownership and is better for spotting which groups of pages are affected over time. If all your city pages share a template and fail on CLS, you have one problem to fix, not forty.
Step 4: Diagnose in Chrome DevTools
Open the page in Chrome, open DevTools and go to the Performance panel. The live metrics screen gives an instant summary of the three vitals. Then use the controls described in the Performance panel reference:
- Switch between mobile and desktop layouts. A responsive design can change the LCP element, so test the phone layout separately.
- Turn on network and CPU throttling. DevTools can recommend settings based on field data, though CPU throttling is relative to your computer and only approximates a real phone.
- Highlight the LCP element to see exactly which image or heading is the bottleneck.
- Inspect layout-shift clusters to see what moved and when.
- Record an interaction to see what slows INP.
When possible, confirm on a real phone as well.
Step 5: Fix the failing metric first
Work on whichever metric fails at the 75th percentile. Do not chase every warning. Google’s web.dev guide to the most effective improvements is the best starting list, and the same advice applies to a roofing page or a dental page as long as you apply it to the real template.
Step 6: Re-measure with real users
Field data lags. Because CrUX-based reports use roughly 28-day windows, expect weeks before a fix shows up fully. Re-test locally right away to confirm the fix works, then watch field data to confirm real visitors benefit.
Fixes that move the numbers on local service sites
Slow LCP
LCP is the vital developers struggle with most. On a contractor or restaurant site the LCP element is nearly always a hero photo or slider. Practical fixes:
- Make the main image discoverable in the HTML rather than loaded late by a script or a slider, and prioritize it.
- Improve server response time. Cheap shared hosting is a frequent cause of slow first loads.
- Use a CDN where appropriate, so visitors across Cook, DuPage and Lake counties are not all waiting on one distant server.
- Serve the image at the size the screen needs, not a full camera-resolution upload.
Avoid the temptation to compress every asset indiscriminately. Find the LCP element first.
Layout shifts
For CLS, reserve space with explicit dimensions for images and other content that loads in. Common local-site offenders are review carousels, cookie banners, embedded maps and promotional bars that push content down after the page appears. A shifting “Call Now” button is the worst version, because it makes people miss the tap that matters.
Sluggish interactions
INP suffers when a page runs too much script. Review third-party tools one at a time: chat widgets, scheduling plug-ins, tracking tags, pop-up forms. Keep what produces leads and remove what only adds weight. Measure with DevTools interaction details before and after so you know what each one costs.
Do Core Web Vitals help local rankings?
Yes, but modestly and in context. Google states that its ranking systems look to reward content that provides a good page experience, and that site owners should not focus on only one or two aspects of it. Good scores do not guarantee top rankings, and relevance remains important.
For a local business that means:
- A fast page with thin content and an unclaimed or inconsistent business listing will not win the map pack.
- A slow page with strong service-area content can still rank, but it loses visitors who give up before it loads.
- Speed is a conversion issue as much as a ranking one. The visitor you earned is the one you lose to a jumping button.
If you want the wider picture of what drives visibility in Chicagoland, our guides on improving local SEO ranking and a practical local SEO checklist cover the content, listing and review work that sits next to performance.
Our perspective: fix what costs you calls
We build sites and run local SEO under one roof, with every service handled in-house by our Google and Meta certified team. That shapes how we treat Core Web Vitals.
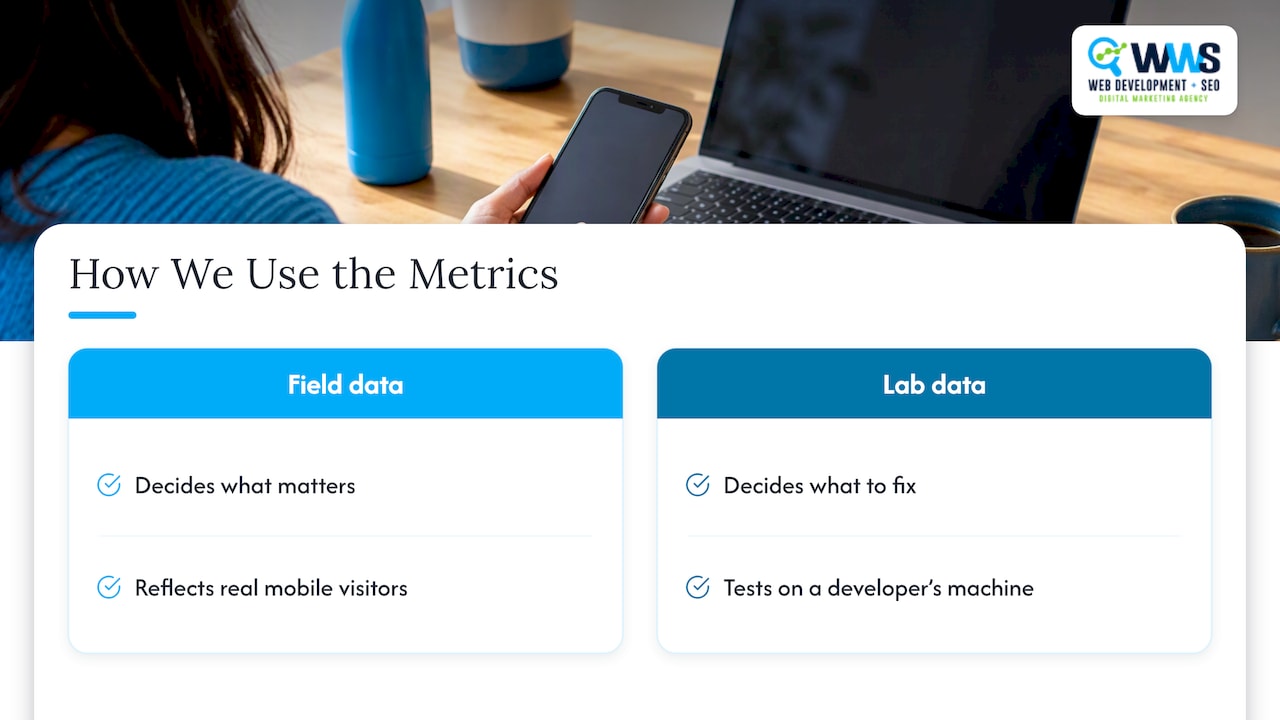
We do not treat a perfect score as the goal. We treat the vitals as a way to find friction that costs a contractor, clinic or restaurant phone calls. Our rule is to let field data decide what matters and lab data decide what to fix. A site that scores well on a developer’s laptop but fails for real mobile visitors has not been tested properly.
We also build performance in from the start rather than patching it later. Template choice, image handling, hosting and the number of third-party scripts decide most of the outcome before a single page goes live. That is why our web design and local SEO work happen together, not as separate projects handled by different vendors.
— Online Marketing Experts
When to bring in help
Most owners can run PageSpeed Insights and read the result. The fixes are where it gets technical: image delivery, server configuration, script loading and template changes need a developer.
If your service pages fail on mobile, our team can audit the templates and fix what is dragging them down. Our website design and hosting service builds fast, mobile-first sites for local businesses, and our local SEO work connects that performance to map pack visibility. For a developer-level walkthrough, see our six-step Core Web Vitals audit for local sites, and for page structure that turns visits into calls, read about local landing page design for Chicago.
Keeping watch after the fix
Speed regresses quietly. A new plug-in, a larger hero photo or a new review widget can undo months of work. Build a light routine:
- Monthly: check Search Console for new failing page groups and run PageSpeed Insights on your top five lead pages.
- After every change: run DevTools live metrics on the page you touched, on mobile settings.
- Quarterly: review third-party scripts and remove anything unused.
If standard dashboards do not reveal which visitors or templates are affected, Google’s web-vitals library measures LCP, INP and CLS in real users’ browsers and matches how Chrome and Google tools report them. A developer can add it to analytics. Note that some values, especially INP, are not ready until the visitor interacts or leaves the page.
Core Web Vitals checklist for a local site
Use this as a working list:
- Choose five to ten pages that generate calls or forms.
- Check mobile field data in PageSpeed Insights for each.
- Confirm verified ownership in Search Console and review the Core Web Vitals report.
- Note which metric fails at the 75th percentile: LCP, INP or CLS.
- Open DevTools, switch to the mobile layout and apply recommended throttling.
- Highlight the LCP element and confirm it loads early and at the right size.
- Add width and height to images and reserve space for banners, maps and review widgets.
- Remove or delay third-party scripts that do not generate leads.
- Check hosting response time and consider a CDN.
- Re-test locally, then watch field data over the following weeks.
FAQ
What is a good Core Web Vitals score?
There is no single score. Google defines good as LCP at or below 2.5 seconds, INP below 200 milliseconds and CLS below 0.1, measured at the 75th percentile of page loads. Mobile and desktop are assessed separately, so check both.
Where can I check my Core Web Vitals for free?
PageSpeed Insights gives a quick URL-level check with field data from the past 28 days. Search Console shows historical results by page group once you verify ownership. Chrome DevTools shows live local metrics on your own device for diagnosis.
Why does my local test pass while Search Console fails?
Your device, network and cache are probably faster than what your customers use. Search Console reflects aggregated real-user data, so it is the better guide to pass or fail. Use the local result to find the cause, not to declare the page fixed.
Will fixing Core Web Vitals get my business into the map pack?
Not on its own. Google says good scores do not guarantee top rankings, and relevance still counts. Treat performance as support for accurate business information, useful service-area content and a good visitor experience.
Sources
- Understanding Core Web Vitals and Google search results
- Understanding Google Page Experience
- Monitor your local and real-user Core Web Vitals performance in DevTools
- Why lab and field data can be different
- Getting started with measuring Web Vitals
- The most effective ways to improve Core Web Vitals
- Performance features reference, Chrome DevTools
- GoogleChrome/web-vitals
Recommended
A Des Plaines, IL team helping local service businesses get found, get called and get booked since 2005: local SEO, Google Ads, conversion-focused websites and AI search optimization.
Meet the teamKeep reading
All articles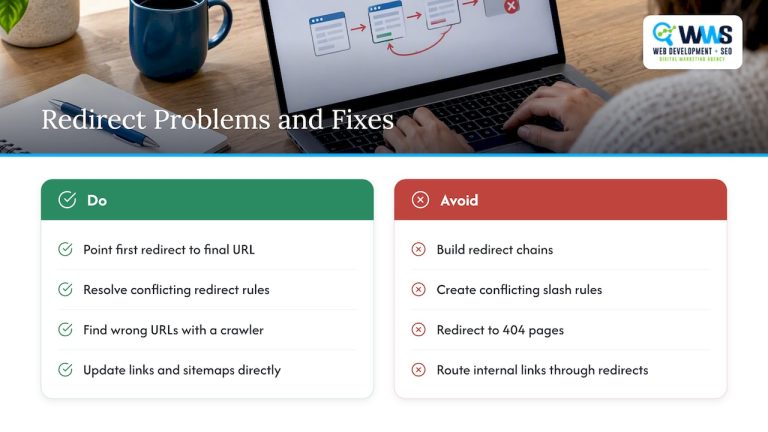
Redirect Strategy for SEO: 301, 302 and Canonical Rules
A practical redirect strategy for SEO: when to use 301 vs 302, when a canonical tag is better, how to avoid chains and loops, and how to verify the result.
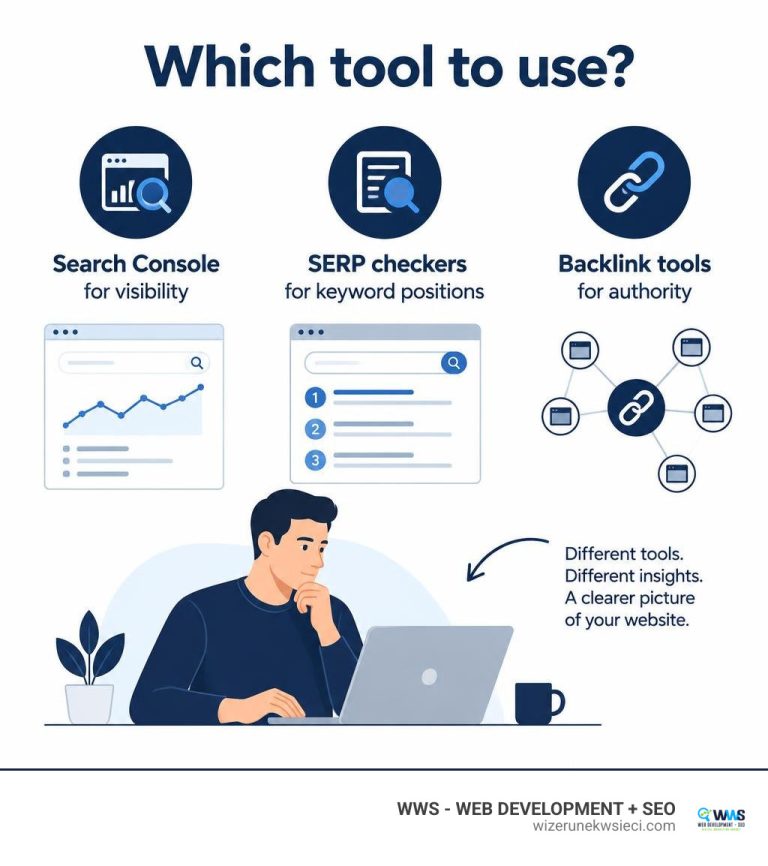
The Best Page Rank Checker Online Tools for Modern SEOs
Use a page rank checker online to audit link equity, track SERP positions, and boost organic visibility with modern SEO authority metrics.
The Best Page Rank Checker Online Tools for Modern SEOs
Use a page rank checker online to audit link equity, track SERP positions, and boost organic visibility with modern SEO authority metrics.